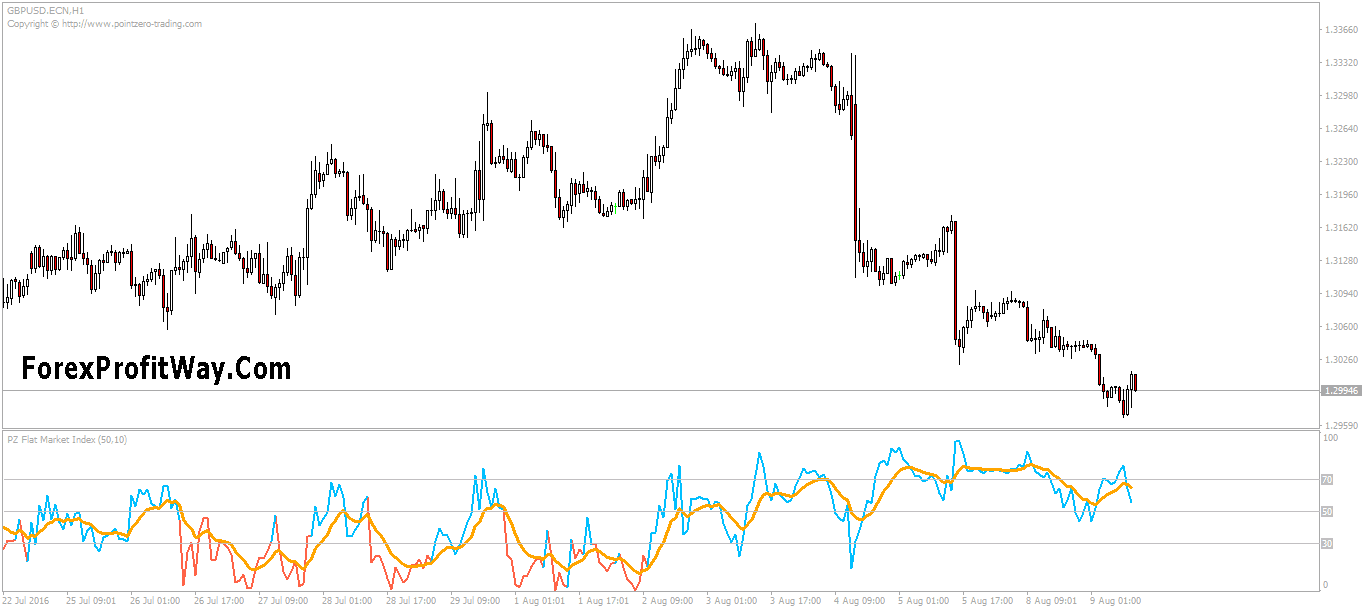
Flat Market Index estimates how much has a security moved in relative terms to identify for you if the market is trending or flat.
The indicator displays a percentage of the recent directional price and does not repaint.
How to trade with Flat Market Index
A value of 100 means that the absolute market movement is trending, while a value of 0 means that the market is absolutely flat or in consolidation. Generally from H1 timeframe, whenever the moving average of the flat market index (FMI) is below 50 level, the price action will tend to be choppy and fluctuating. While above the 50 level, price action will often be trending.
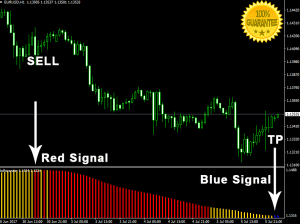
The blue and red lines mean that the price range is healthy and narrow respectively.
It is advisable to use trend-trading strategies and indicators when the Flat Market Index line on a larger timeframe is blue and above the FMI. And use range-trading strategies and indicators when the line on the larger than traded timeframe is red and below the FMI.
In addition, to confirm the above statement see if the traded timeframe is above or below the pivotal 50 level.
Download Now
Browse our full library to download MT4 indicators and improve your trading strategy.
Don't Miss Premium Indicators And Trading Systems


