
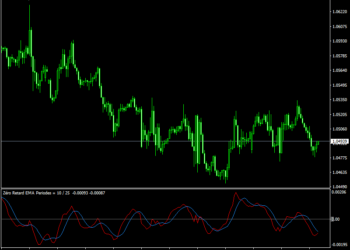
Relative Momentum Index indicator aims to improve the data provided by the classical Relative Strength Index (RSI) if the price reaches an oversold or overbought area. The Relative Momentum Index was introduced by Roger Altman, and in February 1993 was published in the Technical Analysis of Stocks & Commodities magazine.
Relative Momentum Index
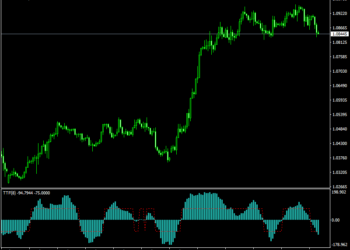
Being a classical oscillator moving in a range from 0 to 100, the RMI indicator enables a trader to detect several formations and possibilities to use in their trading.
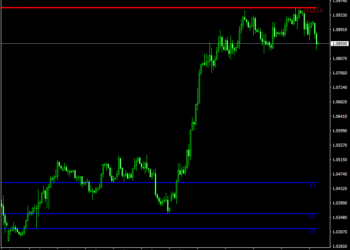
1- Highs and lows
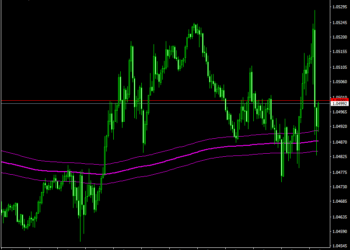
When the Relative Momentum Index crosses the 70% level from above during an overall downtrend, which could be indicated with the help of Multi Moving Average, it is a significant signal that the price should resume the downward movement. Thus, the RMI points to overbought areas and signals further trend continuations.
When the indicator reaches and crosses the 30% level from bellow in an overall uptrend, it is a sure signal that the price has finished the short term correction and is now able to continue moving upwards.
2- Price patterns
The Relative Momentum Index can also form graphical patterns such as triangles, flags, and head and shoulders, which a trader can regard even if this pattern was not present on the price chart.
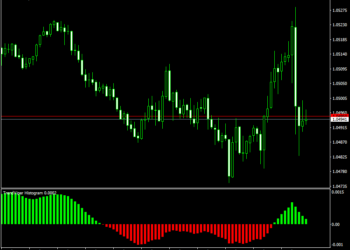
3- Divergence and Convergence signal
As an oscillator, the indicator portrays signal convergence and divergence on the indicator line in comparison with the price action. Such signals are relevant to form decisions of future price behavior and trend strength.
Download Now
Password: forexprofitway.com
Don't Miss Pro Indicators And Trading Systems
