Murrey Math Line X technical analysis system is based on a concept that all markets behave in the similar manner as observed by W.D. Gann. The indicator was developed by T. Henning Murrey in 1995 and described in The Murrey Math Trading System.
Murrey Math Line X
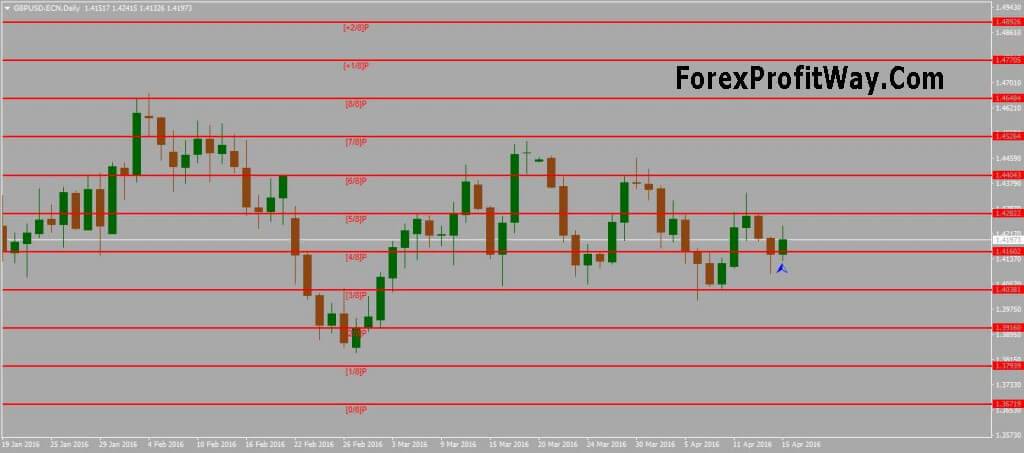
The Murrey Math Line X is calculated using a price movement segment, which is divided into 9 sections. The proportions are split at 0%, 12.5%, 25%, 37.5%, 50%. 62.5%, 75%. 87.5%, 100%, and indicated by lines from 0/8 to 8/8.
Line 1/8: Tends to be a weak line. If the price declines and stops near this line, we have a high possibility that it will reverse upwards. If a price does not stop – it will continue moving towards the 0/8 line.
Lines 2/8 and 6/8: Two very strong levels and are inferior only to the 4/8 line in their ability to reverse the price movement.
Line 3/8: Is a strong level to break from the downside. If a price hits it and fails to break it for two trading weeks, we could expect the price to trade above the line in consolidation between the 3/8-5/8 levels.
Line 4/8: Is a key line. It provides the best support or resistance.
Line 5/8: If the price fluctuates around the 5/8 line for about two weeks, the best short opportunity is between the 3/8 and 5/8 levels. Should the price break below the 5/8 line, it will likely then fall further until the next resistance level.
Line 7/8: Is the weakest resistance/support level. If the price stops near this line, we have a high possibility that it will reverse downwards. If the price does not stop – it will continue moving downwards towards the 8/8 line.
Lines 8/8 and 0/8: Are strong levels providing great resistance and support.
Download Now
Browse our full library to download MT4 indicators and improve your trading strategy.
Don't Miss Premium Indicators And Trading Systems


