Center of Gravity oscillator produces nearly zero lag indications of market corrections and pivot points with precise accuracy. The indicator was a result of studies of adaptive filters by John Ehler and was developed and presented in Stocks & Commodities magazine in 2002.
Center of Gravity oscillator
The Center of Gravity oscillator resembles the stochastic oscillator just has no overbought and oversold areas. It can be used on relatively any time-frame and currency pair.
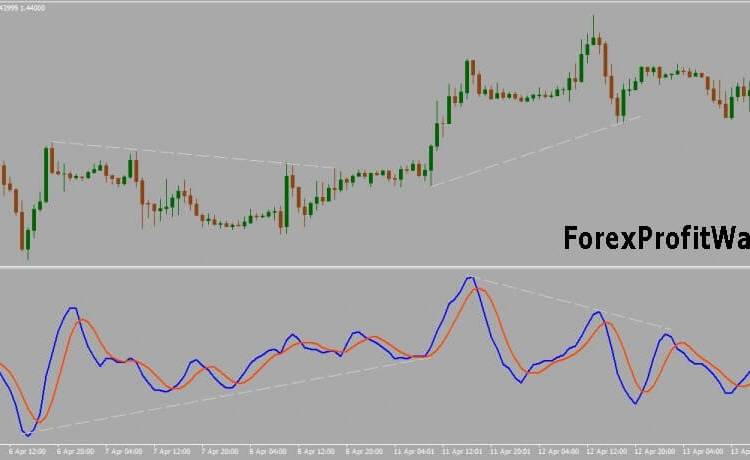
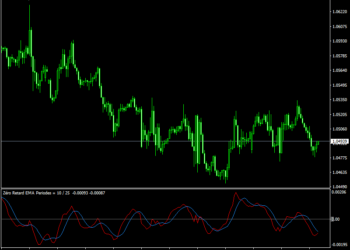
The oscillator draws two signal lines, red and blue. The crossing of them serves as the indicator’s main signal:
-If the red line crosses the blue from bottom up, we can expect a bullish correction.
-While if the red line crosses the blue one at the topside, we can expect a bearish correction.
In addition, signal divergence can also be observed in the Center of Gravity oscillator:
-If the price continues forming lower highs and/or lower lows while the Center of Gravity oscillator remains trending higher, a divergence signal is generated and we can expect an overall trend to shift to bullish.
-Similarly, if the price continues forming higher highs and/or higher lows while the Center of Gravity oscillator remains trending lower, we can expect an overall trend to turn bearish.
Both examples are shown in the graph above.
Formula
CG = -1*NUM/DEN
NUM = int (n, i = 0) [PRICE{i}*{i+1}]
DEN = int (n, i = 0) [PRICE {i}], where
PRICE [i] = the price i bar (bars) back;
PRICE [0] = the current bar price;
PRICE [2] = the price 2 bars back.
Download Now
Don't Miss Pro Indicators And Trading Systems



![Download Trade Assistant [ Stop Guessing ] Forex Indicator For Mt4](https://forexprofitway.com/wp-content/uploads/2017/05/Trade-Assistant.png)
